
Weekly Market Commentary
June 29th, 2026
Week in Review
The week’s data reinforced a backdrop of steady but uneven economic growth, though several areas continue to show signs of moderation under tighter financial conditions.
Preliminary June Purchasing Managers’ Index (PMI) data pointed to stronger-than-expected business activity. Manufacturing PMI improved to 55.7 from the prior reading of 55.1, exceeding expectations and signaling continued strength in the industrial side of the economy. Services PMI came in at 51.3, slightly above expectations, reflecting modest expansion. Overall growth remains intact based on this data, though stronger manufacturing activity alongside slower services growth highlights an uneven expansion.
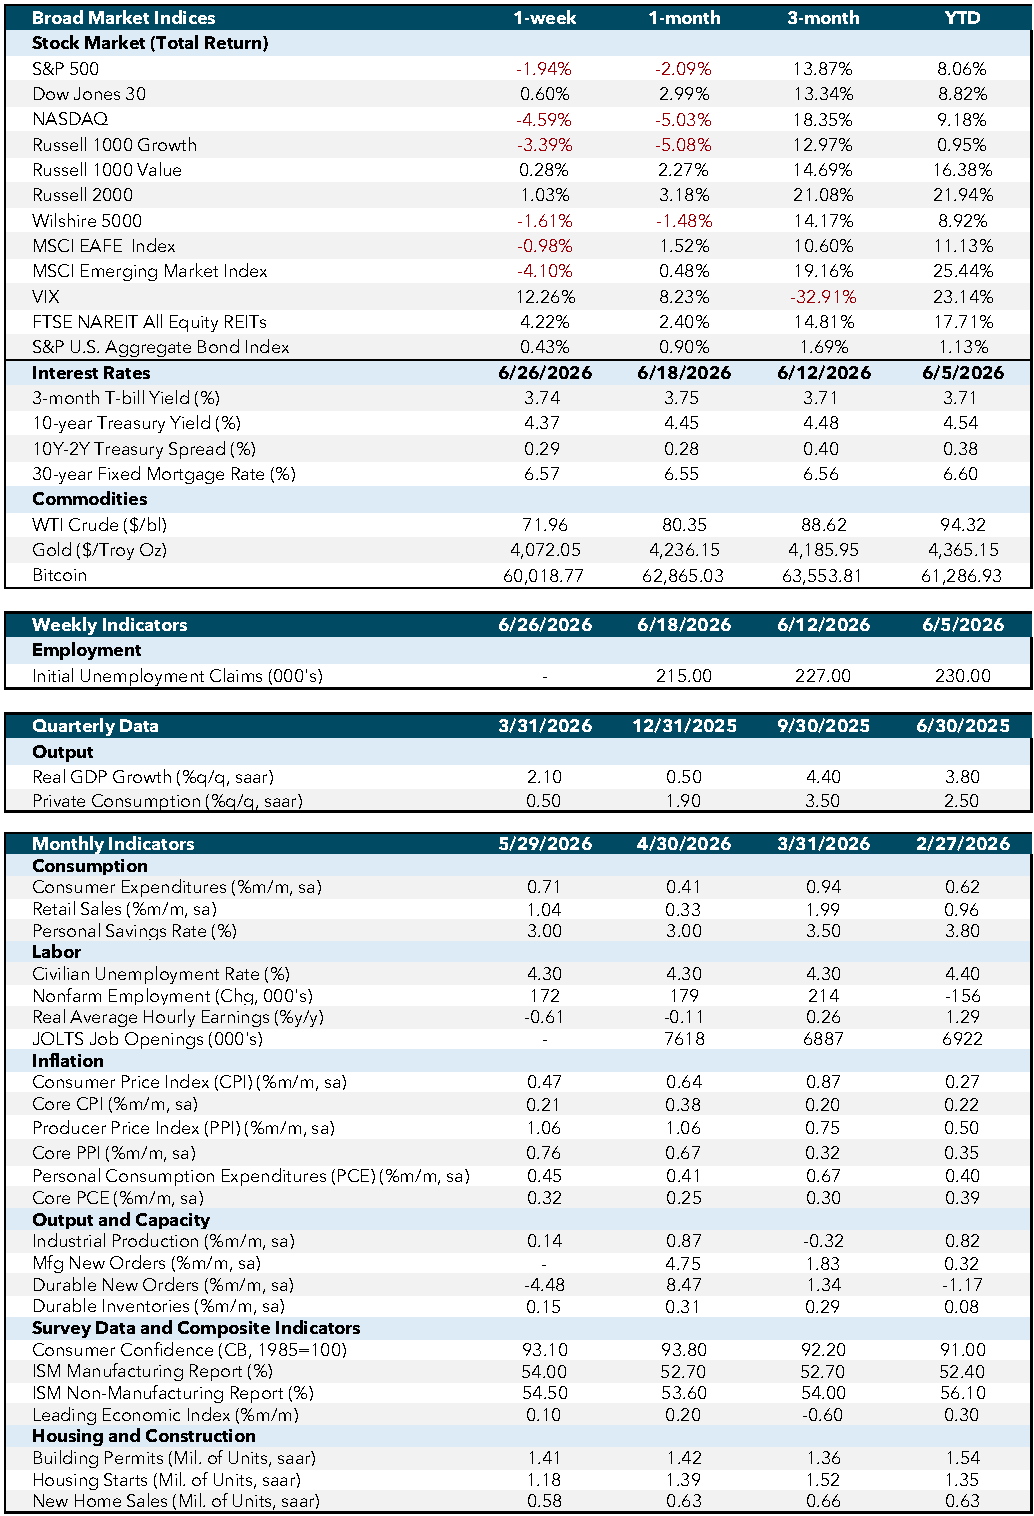
Housing data showed renewed softness. New home sales for May declined to 580,000 from 626,000 in April and fell well short of expectations. The decline reflects ongoing affordability challenges tied to elevated mortgage rates and reinforces that housing remains a pocket of weakness within the U.S. economy.
Inflation data continued to show gradual progress. Core Personal Consumption Expenditures (PCE) for May rose 0.3% month-over-month, in line with expectations, while the year-over-year inflation rate held at 3.4%. This indicates that underlying price pressures remain elevated relative to the Fed’s 2% target, and progress toward price stability continues at a gradual pace. Inflation also appears to be stabilizing rather than accelerating, reinforcing a higher-for-longer policy outlook.
Durable goods orders declined by 4.5% in May following a strong prior month, a smaller drop than expected. The pullback was driven largely by volatility in transportation orders, particularly aircraft. However, underlying trends were more constructive, with orders excluding transportation and core capital goods both increasing. This suggests that business investment remains stable despite variability in the headline figure.
Labor market data remained a source of strength. Initial jobless claims came in at 215,000, below expectations and consistent with a labor market that remains healthy. Layoffs continue to be limited, supporting the view that employment conditions are stable even as hiring momentum shows signs of slowing.
Overall, the latest data present a mixed view of the economy. Activity remains supported in several areas, though the pace of growth appears uneven across sectors. Labor market conditions continue to show stability, while housing and some measures of business investment reflect more sensitivity to current conditions. In aggregate, the data highlights an economic backdrop that remains intact but lacks uniform strength heading into the second half of the year.
Economic and Capital Markets Dashboard
Week Ahead…

The upcoming week is shortened by the July 4 holiday but still brings several important releases that will help shape the outlook for growth, labor market conditions, and business activity heading into the second half of the year.
Tuesday’s releases include the June consumer confidence report and the Job Openings and Labor Turnover Survey (JOLTS) report. Consumer confidence will be closely watched to see how households are responding to still-elevated prices and borrowing costs. JOLTS job openings are expected to edge lower, pointing to a gradual cooling in labor demand, remaining consistent with a relatively tight labor market.
On Wednesday, the focus will shift to employment and manufacturing. The ADP Nonfarm Employment Change for June should provide an early read on private-sector hiring, with expectations for moderate job growth. ISM manufacturing PMI for June is projected to ease slightly but remain in expansion territory, offering a clearer view on whether recent strength in manufacturing activity is holding or beginning to moderate.
Thursday turns to the June employment report. Nonfarm payrolls are expected to reflect a step down in hiring from the prior month, while the unemployment rate is projected to remain broadly stable. Wage growth will also be closely monitored for signs of persistent labor market tightness. Together, the data will help determine whether labor conditions are continuing to cool gradually or showing signs of a more meaningful slowdown.
Overall, the week should further clarify the current macro narrative. Consumer sentiment and job openings will offer additional clarity on labor market trends, while ISM manufacturing will offer further insight into the trajectory of industrial activity.
Economic Indicators:
- CPI: Consumer Price Index measures the average change in prices paid by consumers for goods and services over time. Source: Bureau of Labor Statistics.
- Core CPI: Core Consumer Price Index excludes food and energy prices to provide a clearer picture of long-term inflation trends. Source: Bureau of Labor Statistics.
- PPI: Producer Price Index measures the average change in selling prices received by domestic producers for their output. Source: Bureau of Labor Statistics.
- Core PPI: Core Producer Price Index excludes food and energy prices to provide a clearer picture of long-term inflation trends. Source: Bureau of Labor Statistics.
- PCE: Personal Consumption Expenditures measure the average change in prices paid by consumers for goods and services. Source: Bureau of Economic Analysis.
- Core PCE: Core Personal Consumption Expenditures exclude food and energy prices to provide a clearer picture of long-term inflation trends. Source: Bureau of Economic Analysis.
- Industrial Production: Measures the output of the industrial sector, including manufacturing, mining, and utilities. Source: Federal Reserve.
- Mfg New Orders: Measures the value of new orders placed with manufacturers for durable and non-durable goods. Source: Census Bureau.
- Durable New Orders: Measures the value of new orders placed with manufacturers of durable goods. Source: Census Bureau.
- Durable Inventories: Measures the value of inventories held by manufacturers for durable goods. Source: Census Bureau.
- Consumer Confidence (CB, 1985=100): Measures the degree of optimism that consumers feel about the overall state of the economy and their personal financial situation. Source: Conference Board.
- ISM Manufacturing Report: Measures the economic health of the manufacturing sector based on surveys of purchasing managers. Source: Institute for Supply Management.
- ISM Non-Manufacturing Report: Measures the economic health of the non-manufacturing sector based on surveys of purchasing managers. Source: Institute for Supply Management.
- Leading Economic Index: Measures overall economic activity and predicts future economic trends. Source: Conference Board.
- Building Permits (Mil. of Units, saar): Measures the number of new residential building permits issued. Source: Census Bureau.
- Housing Starts (Mil. of Units, saar): Measures the number of new residential construction projects that have begun. Source: Census Bureau.
- New Home Sales (Mil. of Units, saar): Measures the number of newly constructed homes sold. Source: Census Bureau.
- SA: Seasonally adjusted.
- SAAR: Seasonally adjusted annual rate.
Market Indices & Indicators:
- S&P 500: A market-capitalization-weighted index of 500 leading publicly traded companies in the U.S., widely regarded as one of the best gauges of large U.S. stocks and the stock market overall.
- Dow Jones 30: Also known as the Dow Jones Industrial Average, it tracks the share price performance of 30 large, publicly traded U.S. companies, serving as a barometer of the stock market and economy.
- NASDAQ: The world’s first electronic stock exchange, primarily listing technology giants and operating 29 markets globally.
- Russell 1000 Growth: Measures the performance of large-cap growth segment of the U.S. equity universe, including companies with higher price-to-book ratios and growth metrics.
- Russell 1000 Value: Measures the performance of large-cap value segment of the U.S. equity universe, including companies with lower price-to-book ratios and growth metrics.
- Russell 2000: A market index composed of 2,000 small-cap companies, widely used as a benchmark for small-cap mutual funds.
- Wilshire 5000: A market-capitalization-weighted index capturing the performance of all American stocks actively traded in the U.S., representing the broadest measure of the U.S. stock market.
- MSCI EAFE Index: An equity index capturing large and mid-cap representation across developed markets countries around the world, excluding the U.S. and Canada.
- MSCI Emerging Market Index: Captures large and mid-cap representation across emerging markets countries, covering approximately 85% of the free float-adjusted market capitalization in each country.
- VIX: The CBOE Volatility Index measures the market’s expectations for volatility over the coming 30 days, often referred to as the “fear gauge.”
- FTSE NAREIT All Equity REITs: Measures the performance of all publicly traded equity real estate investment trusts (REITs) listed in the U.S., excluding mortgage REITs.
- S&P U.S. Aggregate Bond Index: Represents the performance of the U.S. investment-grade bond market, including government, corporate, mortgage-backed, and asset-backed securities.
- 3-Month T-bill Yield (%): The yield on U.S. Treasury bills with a maturity of three months, reflecting short-term interest rates.
- 10-Year Treasury Yield (%): The yield on U.S. Treasury bonds with a maturity of ten years, reflecting long-term interest rates.
- 10Y-2Y Treasury Spread (%): The difference between the yields on 10-year and 2-year U.S. Treasury bonds, often used as an indicator of economic expectations.
- WTI Crude ($/bl): The price per barrel of West Texas Intermediate crude oil, a benchmark for U.S. oil prices.
- Gold ($/Troy Oz): The price per troy ounce of gold, a standard measure for gold prices.
- Bitcoin: A decentralized digital currency without a central bank or single administrator, which can be sent from user to user on the peer-to-peer bitcoin network.
This content was developed by Cambridge from sources believed to be reliable. This content is provided for informational purposes only and should not be construed or acted upon as individualized investment advice. It should not be considered a recommendation or solicitation. Information is subject to change. Any forward-looking statements are based on assumptions, may not materialize, and are subject to revision without notice. The information in this material is not intended as tax or legal advice.
Investing involves risk. Depending on the different types of investments there may be varying degrees of risk. Socially responsible investing does not guarantee any amount of success. Clients and prospective clients should be prepared to bear investment loss including loss of original principal. Indices mentioned are unmanaged and cannot be invested into directly. Past performance is not a guarantee of future results.
The Dow Jones Industrial Average (DJIA) is a price-weighted index composed of 30 widely traded blue-chip U.S. common stocks. The S&P 500 is a market-cap weighted index composed of the common stocks of 500 leading companies in leading industries of the U.S. economy. The NASDAQ Composite Index is a market-value weighted index of all common stocks listed on the NASDAQ stock exchange.
Securities offered through Cambridge Investment Research, Inc., a broker-dealer, member FINRA/SIPC, and investment advisory services offered through Cambridge Investment Research Advisors, Inc., a Registered Investment Adviser. Both are wholly-owned subsidiaries of Cambridge Investment Group, Inc. V.CIR.0626-2443